
Collaborative work by Kelton Argraves, Briana Thallmayer, and David Boudreaux.
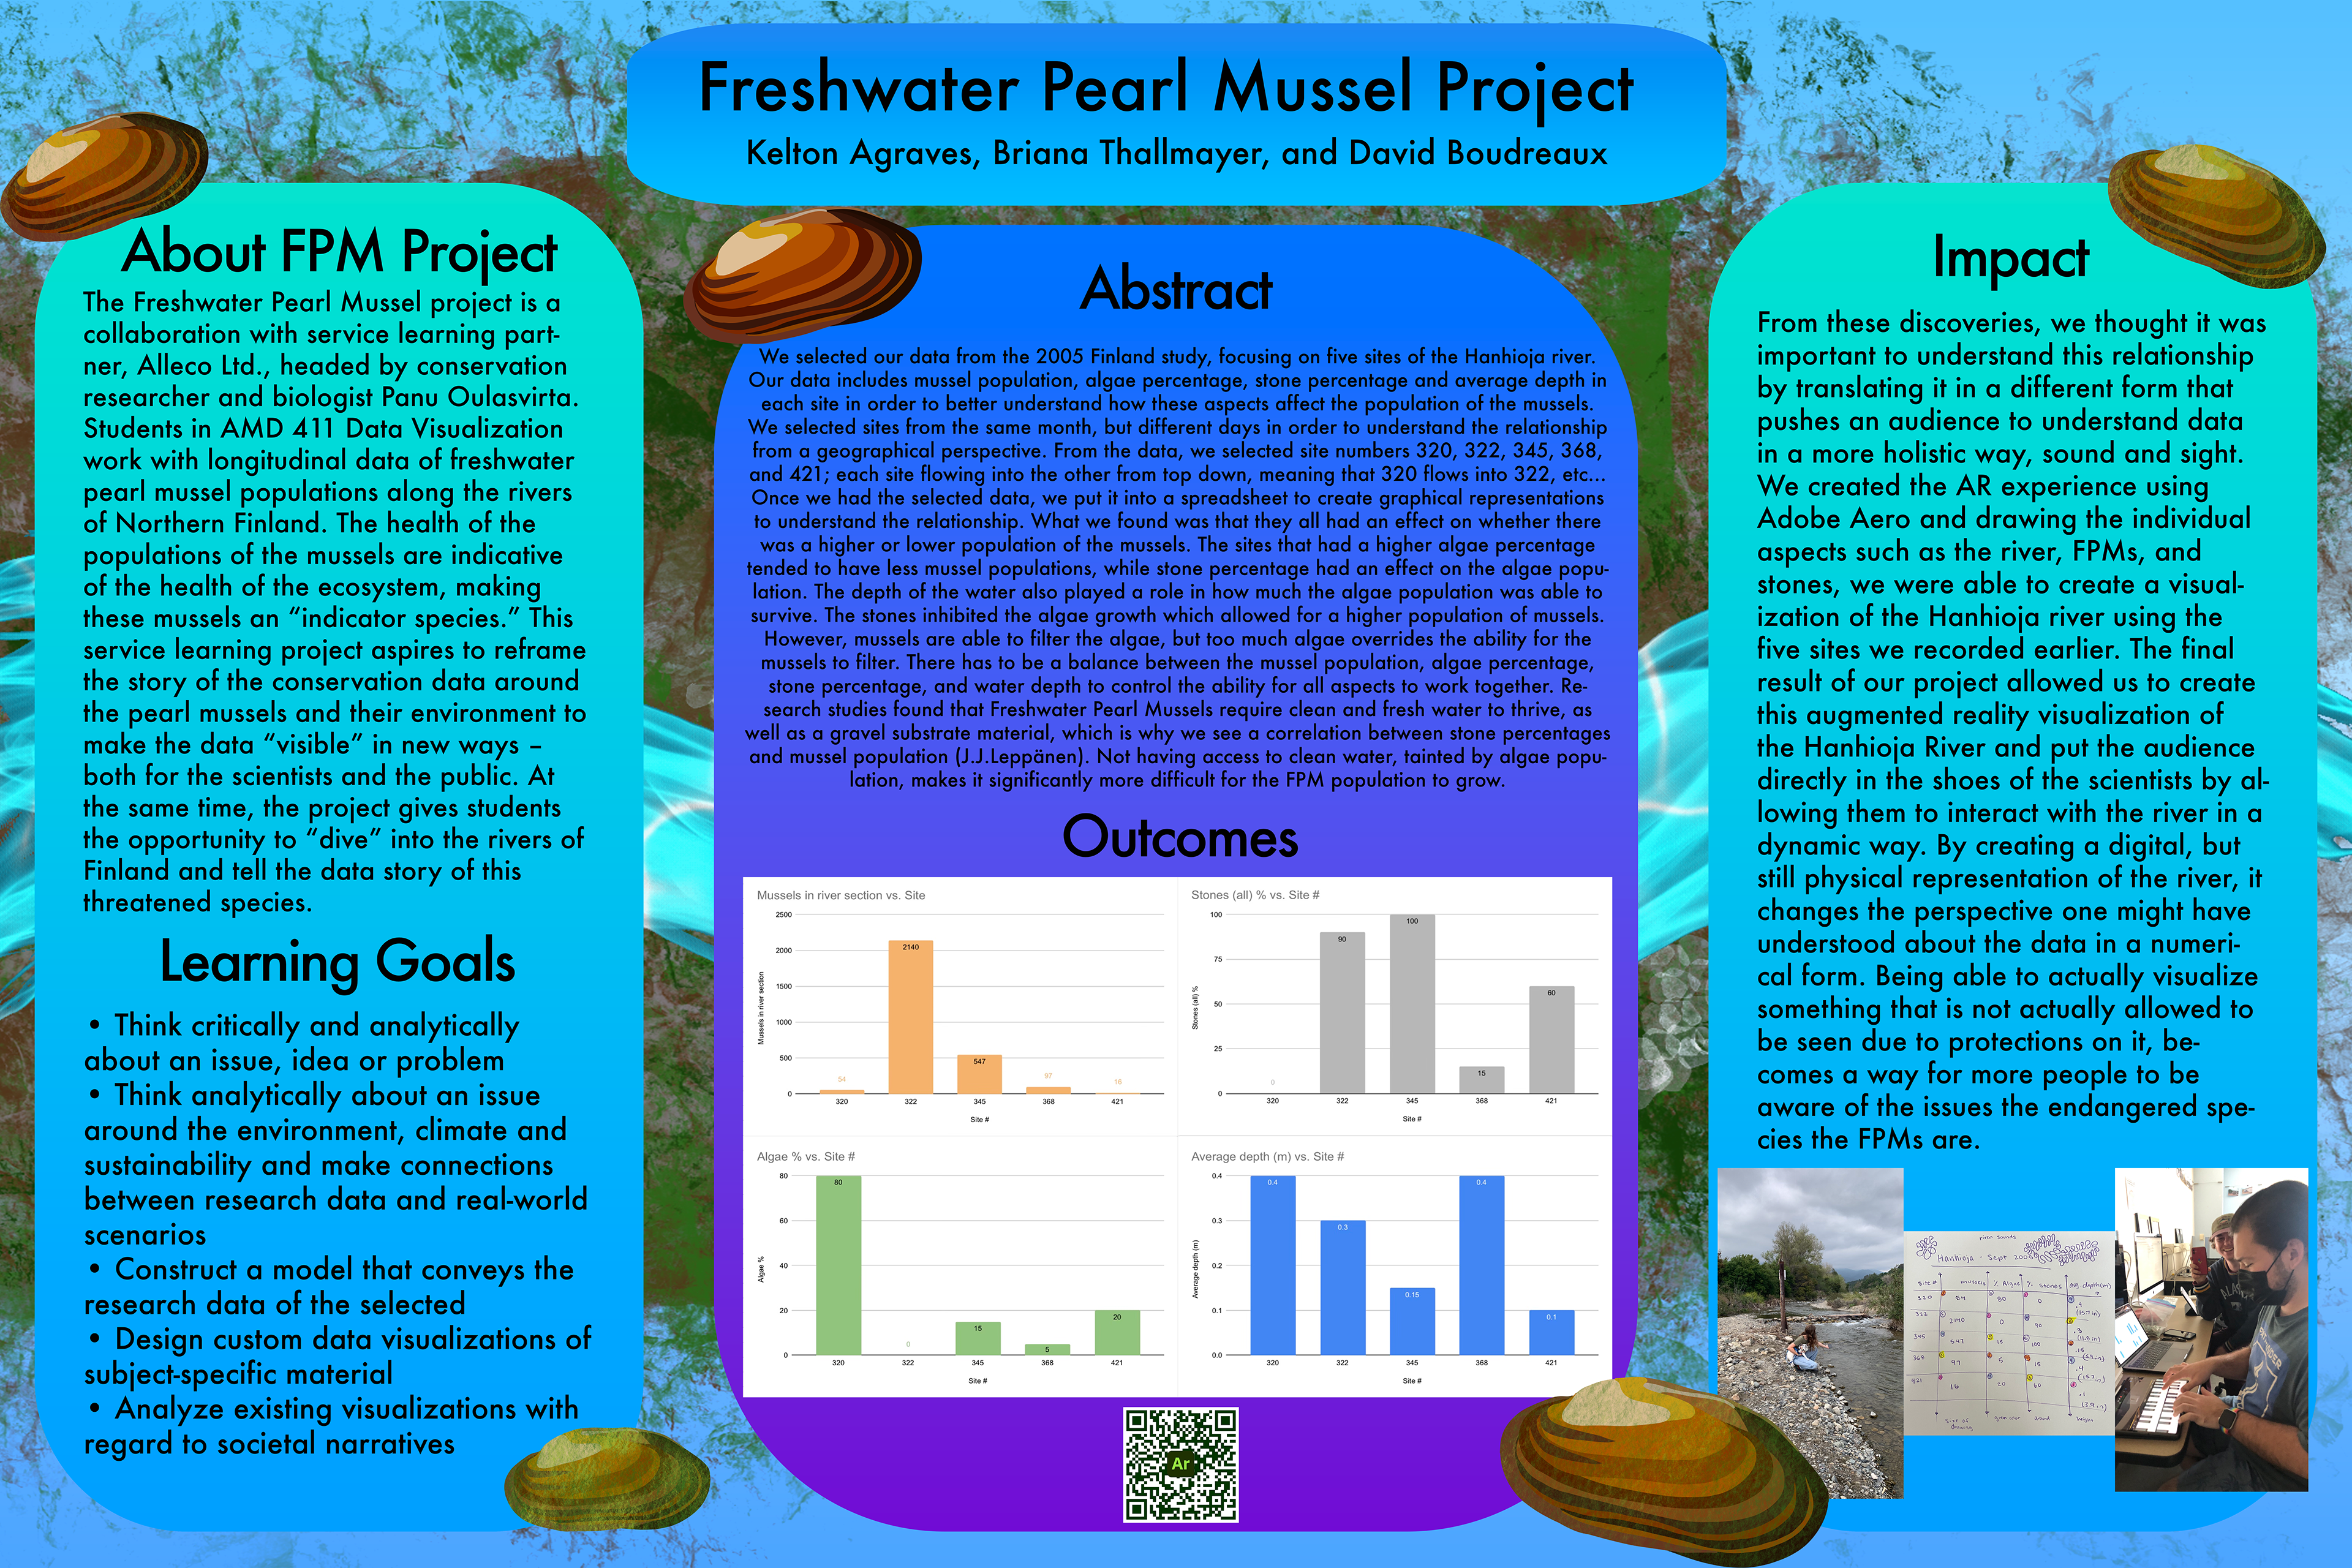
We selected our data from the 2005 Finland study, focusing on five sites of the Hanhioja river. Our data includes mussel population, algae percentage, stone percentage and average depth in each site in order to better understand how these aspects affect the population of the mussels. We selected sites from the same month, but different days in order to understand the relationship from a geographical perspective. From the data, we selected site numbers 320, 322, 345, 368, and 421; each site flowing into the other from top down, meaning that 320 flows into 322, etc… Once we had the selected data, we put it into a spreadsheet to create graphical representations to understand the relationship. What we found was that they all had an effect on whether there was a higher or lower population of the mussels. The sites that had a higher algae percentage tended to have less mussel populations, while stone percentage had an effect on the algae population. The depth of the water also played a role in how much the algae population was able to survive. The stones inhibited the algae growth which allowed for a higher population of mussels. However, mussels are able to filter the algae, but too much algae overrides the ability for the mussels to filter. There has to be a balance between the mussel population, algae percentage, stone percentage, and water depth to control the ability for all aspects to work together. Research studies found that Freshwater Pearl Mussels require clean and fresh water to thrive, as well as a gravel substrate material, which is why we see a correlation between stone percentages and mussel population (J.J.Leppänen). Not having access to clean water, tainted by algae population, makes it significantly more difficult for the FPM population to grow.
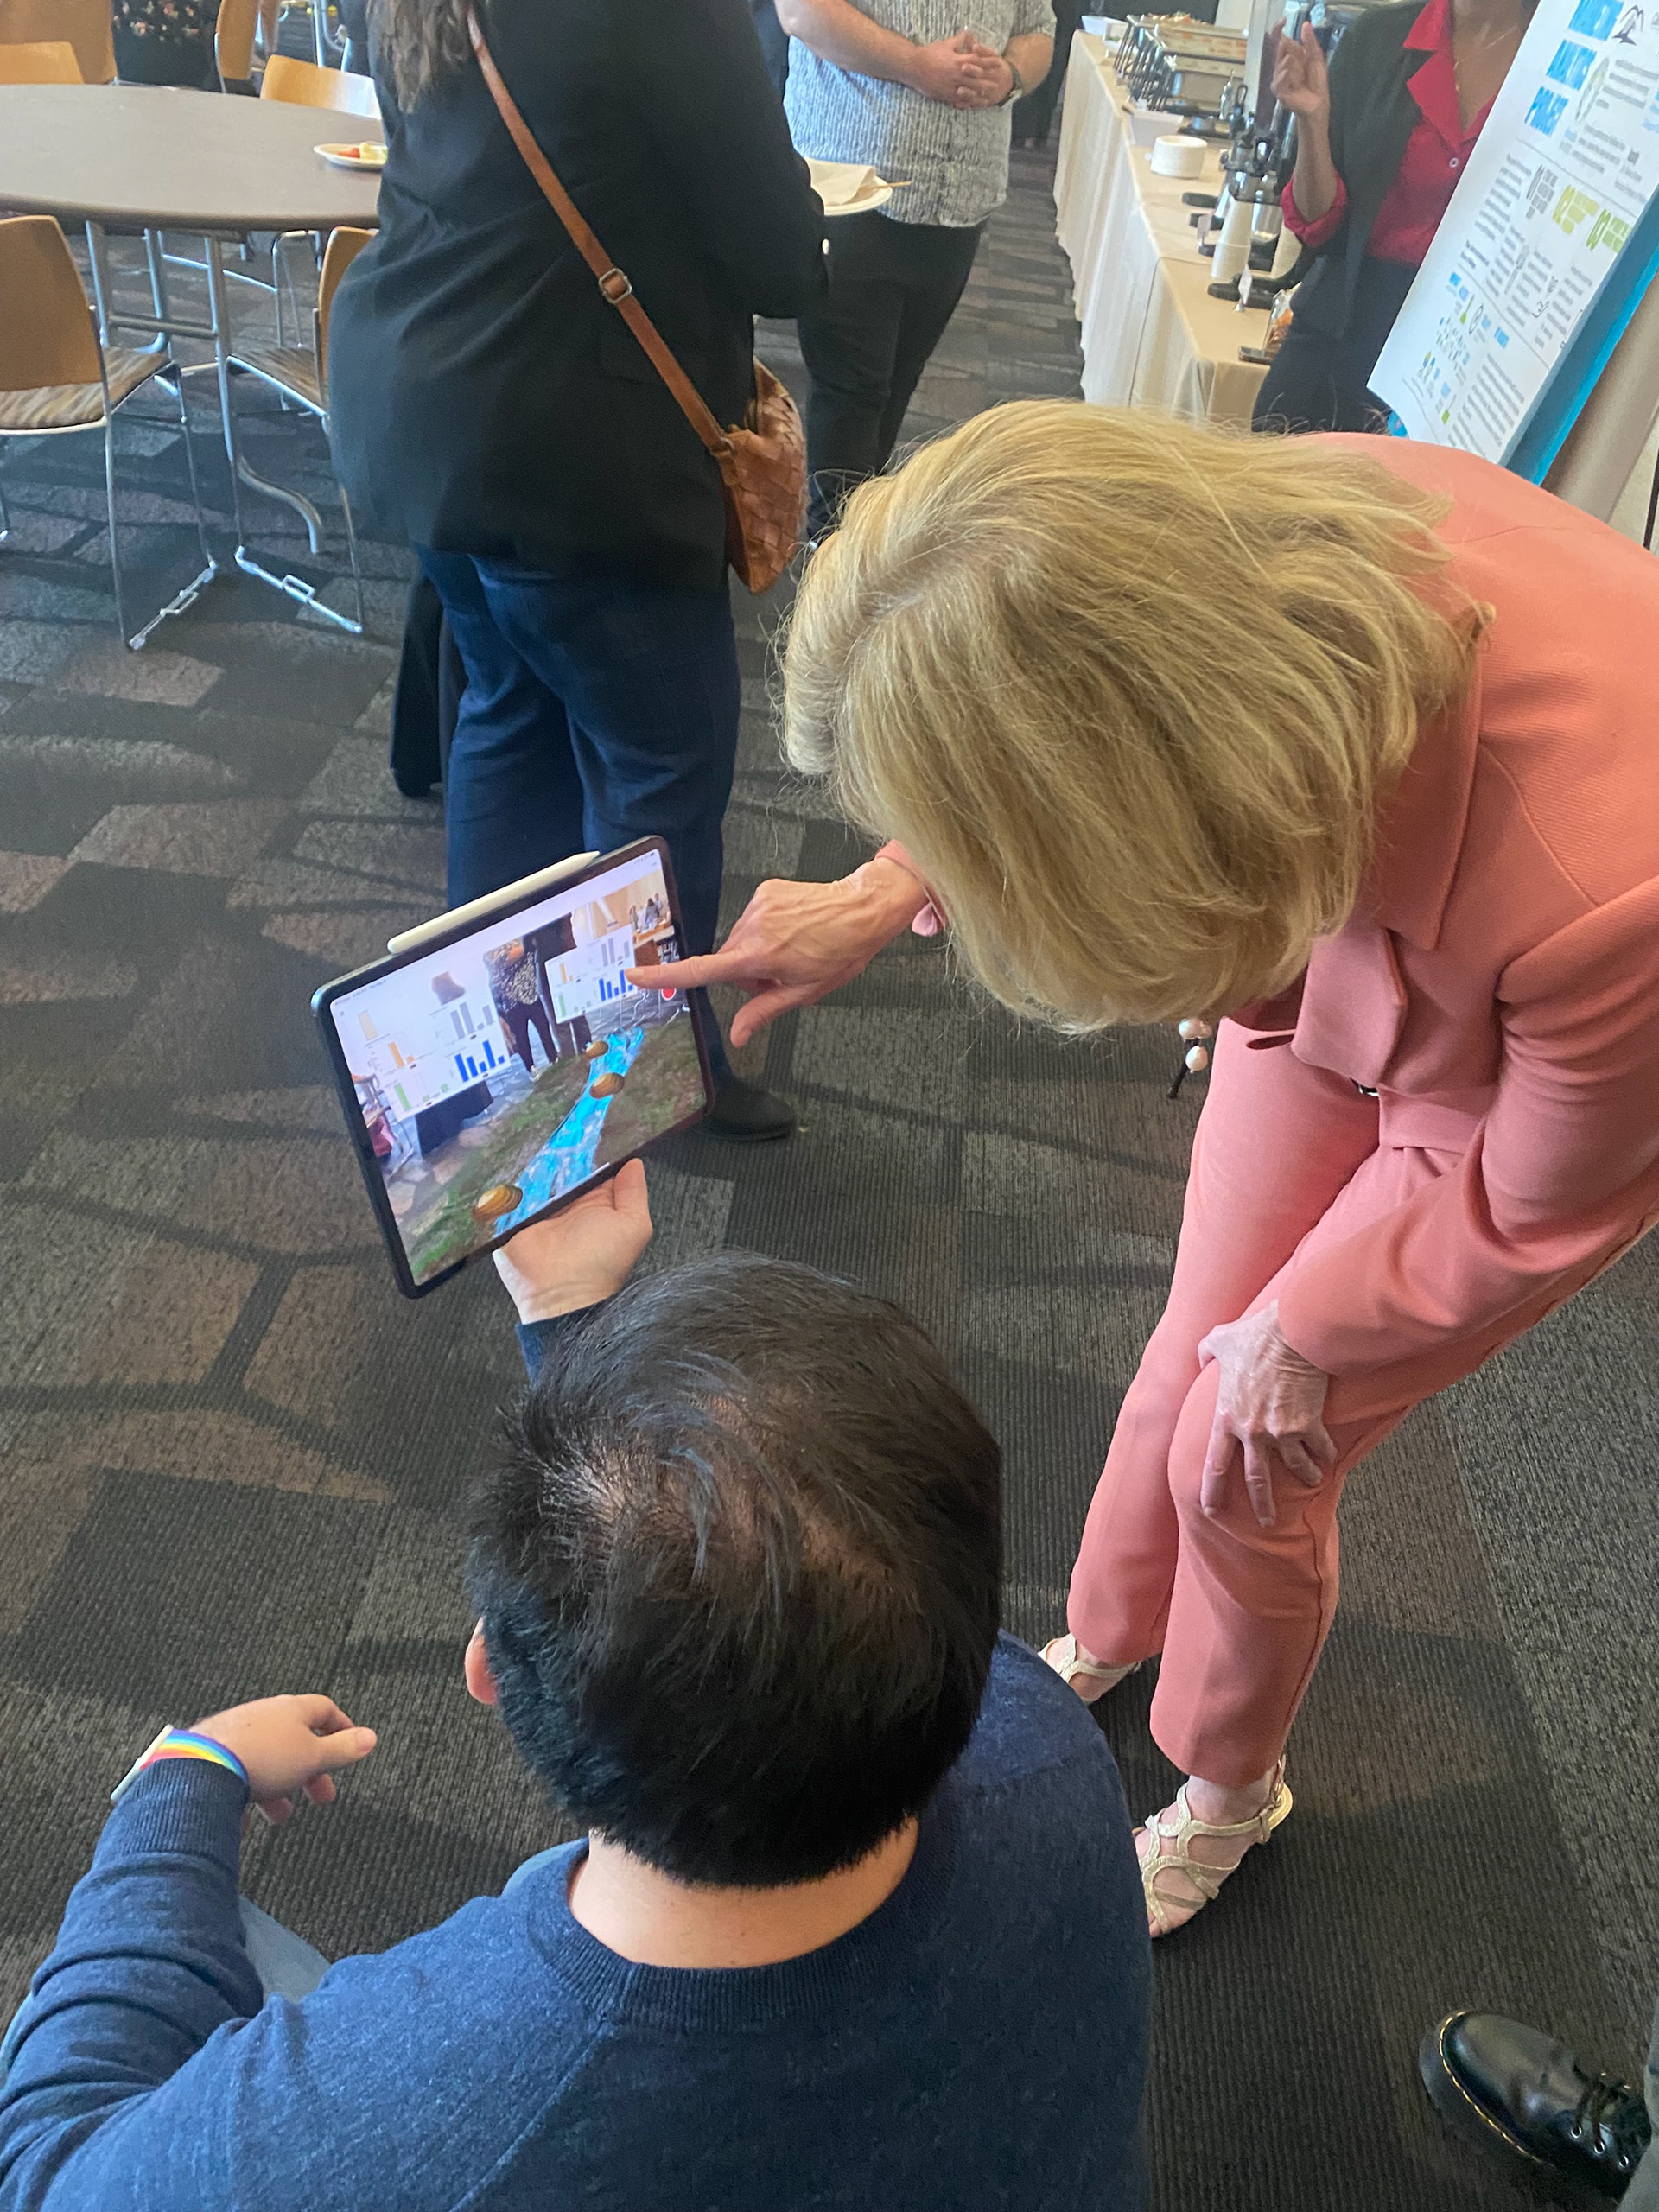
From these discoveries, we thought it was important to understand this relationship by translating it in a different form that pushes an audience to understand data in a more holistic way, sound and sight. Using the graphs, we first labeled each point based on a hierarchy of lowest to highest value from a scale of 1-5 in order to establish the levels. With this, we utilized GarageBand to play a piano instrument in different pitches to correlate to the scale that we established previously. Using this scale, each chord was played at a pitch that was connected to the height of the bars on each graph, with each aspect recorded having its own instrument play. Finally, we put the composition together, playing all four aspects together to understand the relationship between the four aspects within the five total sites we recorded. However, we wanted to expand on this idea, as we decided to push it into an augmented reality space to fully visualize how this data and sound work together. We found inspiration from a couple artists who utilized Adobe Aero to visualize their artwork into augmented reality. Artists Mercedes Dorame, I.R. Bach, Glenn Kaino, Ruben Ochoa, and Ada Pinkston worked together to create a virtual monument that can be accessed from anywhere in the world through a QR code (LACMA x Snapchat: Monumental Perspectives). They consulted with historians and community leaders in order to highlight historical moments that occurred in specific areas. We wanted to utilize the data from the Finland study in a similar way, by visualizing something that is typically hidden from public view, and allowing for anyone to access this data in this relatively new form of art. Creating the AR experience using Adobe Aero and drawing the individual aspects such as the river, FPMs, and stones, we were able to create a visualization of the Hanhioja river using the five sites we recorded earlier. Each site would be separated by the FPM representation, where pressing on them reveals what site they belong to. The actual FPM is different visually based on the amount of algae in the population, some having more algae attached to them. The height that the FPM floats also correlates to the depth of the water for the site it is in. There is also the aspect of the stone percentage, with each site being covered in the percentage of stones recorded. When clicking on a FPM, you can see the graph that shows the data for that site, clicking the graph plays the audio clip from the first translation.
The final result of our project allowed us to create this augmented reality visualization of the Hanhioja River and put the audience directly in the shoes of the scientists by allowing them to interact with the river in a dynamic way. By creating a digital, but still physical representation of the river, it changes the perspective one might have understood about the data in a numerical form. Being able to actually visualize something that is not actually allowed to be seen due to protections on it, becomes a way for more people to be aware of the issues the endangered species the FPMs are.
Sources:
FPM Kolarctic Data 2003-2005. Accessed through Canvas.
“LACMA × Snapchat: Monumental Perspectives.” LACMA, The Andrew W. Mellon Foundation, https://www.lacma.org/art/exhibition/lacma-snapchat-monumental-perspectives.
Leppänen , J J , Timo , S , Jilbert , T & Oulasvirta , P 2020 , ' The analysis of freshwater pearl mussel shells using µ-XRF (Micro X-Ray Fluorescence) and the applicability for environmental reconstruction ' , SN Applied Sciences , vol. 3 , no. 1 . https://doi.org/10.1007/s42452-020-03978-3 https://www.researchgate.net/publication/347560164_The_analysis_of_freshwater_pearl_mussel_shells_using_-XRF_micro-x-ray_fluorescence_and_the_applicability_for_environmental_reconstruction